Ok, let’s continue our look at adding background colours to the spirograph images.
We’ll start by looking at using a different colourmaps for the curve and the background.
Varying colourmaps
I have to admit my do-all spirograph module is in terrible shape. A serious refactor is needed. So I probably won’t be making the module available at this time. Well, perhaps never. I’ll just cover the bits of additional code I used to do what I wanted to do.
Which colourmaps?
I started by looking at the colourmaps on the matplotlib web site. I then created a dictionary with a key for each of the colourmaps I currently use to generate the spirograph curves/images/plots. Then I made some guesses about which colourmaps might go with each one of them and hardcoded that as a list value for each colourmap key.
Things got a little messy at this point. I built the keys and lists using strings, colourmap names. But, I need colourmap objects for the plotting function calls. E.G. to imshow(). So I created another dictionary keyed on all the colourmap names. The value for each key being the appropriate plt.cm object. Both dictionaries were added after the colourmap arrays I had been using until now. Likely a spot for a goodly bit of refactoring.
clr_opt = ['default', 'GnBu', 'PuBu', 'viridis', 'hot', 'twilight_shifted',
  'plasma', 'PuRd', 'winter', 'rainbow', 'turbo', 'magma', 'PuBuGn', 'bone', 'jet']
clr_cmap = [plt.cm.tab10, plt.cm.GnBu_r, plt.cm.PuBu_r, plt.cm.viridis, plt.cm.hot, plt.cm.twilight_shifted,
  plt.cm.plasma, plt.cm.PuRd_r, plt.cm.winter, plt.cm.rainbow, plt.cm.turbo, plt.cm.magma,
  plt.cm.PuBuGn_r, plt.cm.bone, plt.cm.jet]
bg_cmap = {
  'default': ['default', 'tab20', 'tab20c'],
  'GnBu': ['GnBu', 'viridis', 'YlGnBu', 'summer'],
  'PuBu': ['PuBu', 'PuBuGn', 'summer'],
  'viridis': ['GnBu', 'YlGnBu', 'summer'],
  'hot': ['hot', 'YlOrRd', 'reds', 'autumn', 'gnuplot'],
  'twilight_shifted': ['twilight_shifted', 'gist_earth', 'cubehelix', 'copper'],
  'plasma': ['plasma', 'RdPu', 'inferno', 'magma'],
  'PuRd': ['PuRd', 'RdPu', 'inferno', 'magma'],
  'winter': ['winter', 'GnBu', 'BuGn'],
  'rainbow': ['rainbow', 'jet', 'turbo', 'cool'],
  'turbo': ['turbo', 'rainbow', 'jet', 'cool'],
  'magma': ['magma', 'plasma', 'RdPu', 'inferno'],
  'PuBuGn': ['PuBuGn', 'PuBu', 'BuPu'],
  'bone': ['bone', 'winter', 'gray', 'cividis'],
  'jet': ['jet', 'rainbow', 'turbo', 'terrain']
}
# bgcm_mpl[np.random.choice(bg_cmap[rcm])]
bgcm_mpl = {
  'autumn': plt.cm.autumn, 'bone': plt.cm.bone, 'BuGn': plt.cm.BuGn, 'BuPu': plt.cm.BuPu,
  'cividis': plt.cm.cividis,
  'cubehelix': plt.cm.cubehelix, 'cool': plt.cm.cool ,'copper': plt.cm.copper,
  'default': plt.cm.tab10, 'GnBu': plt.cm.GnBu,
  'gist_earth': plt.cm.gist_earth, 'gnuplot': plt.cm.gnuplot, 'gray': plt.cm.gray,
  'hot': plt.cm.hot, 'inferno': plt.cm.inferno,
  'jet': plt.cm.jet, 'magma': plt.cm.magma, 'plasma': plt.cm.plasma,
  'PuBu': plt.cm.PuBu, 'PuBuGn': plt.cm.PuBuGn, 'PuRd': plt.cm.PuRd, 'rainbow': plt.cm.rainbow,
  'RdPu': plt.cm.RdPu, 'reds': plt.cm.Reds,
  'summer': plt.cm.summer, 'tab20': plt.cm.tab20, 'tab20c': plt.cm.tab20c, 'terrain': plt.cm.terrain,
  'turbo': plt.cm.turbo, 'twilight_shifted': plt.cm.twilight_shifted, 'viridis': plt.cm.viridis,
  'winter': plt.cm.winter, 'YlGnBu': plt.cm.YlGnBu, 'YlOrRd': plt.cm.YlOrRd
}
Now all I had to do was select a random colourmap from the ones available for the current curve colourmap. Then use that, if appropriate, to generate the coloured background. Well that all I had to do was of course not quite that simple.
Some New Options
I have in my module been using a large number of variables to control what should happen on each iteration. I have one for the number of data points. I have another for whether or not I should repeat using the current set of curve parameters or randomly generate another set. I have one for whether or not to put a title section on the plot. Another for whether or not to save the current plot (usually a repeat of the one I just looked at). I allow for requiring/requesting a specific plot type, a specific wheel shape and the type of cycling line plot to generate (if appropriate).
I decided to add a few more for controlling what happens with the background.
use_bg = False  # use solid background colour
use_gd = False  # use gradient background
use_bb = False  # use blotchy background
use_bb2 = True  # use 2nd version blotchy background
use_rand_bg = True  # select bg colourmap from list available for current curve colourmap
bb2_dim = 5     # number of dimensions to use with bb2 type backgrounds
bg_cmap = None  # background colourmap
c_bg = "w"      # solid background colour
I refactored the functions that parse the user input for each loop. As well as number of individual checks for some of the other control variables. All in all it looks something like the following.
# reworking user input process
def sort_usr_input(u_in):
  global mx_plt
  """extract plot number and any additional parameters that are present"""
  upl, uwh, uwt, ulx, utl, uua, uba, usv = None, None, None, None, True, False, False, False
  if u_in.isnumeric():
    t_plt = int(u_in)
    if t_plt >= 1 and t_plt <= mx_plt:
      upl = t_plt
  elif '.' in u_in:
    dot = u_in.index('.')
    if u_in[:dot].isnumeric:
      t_plt = int(u_in[:dot])
      if t_plt >= 1 and t_plt <= mx_plt:
        upl = t_plt
        if dot + 1 != len(u_in):
          uwh, uwt, ulx, utl, uua, uba, usv = get_parameters(u_in[dot+1:])

  return upl, uwh, uwt, ulx, utl, uua, uba, usv


def get_parameters(prs):
  """break down any extra parameters supplied by user"""
  p_wh = None
  p_sh = None
  p_lx = None
  p_tl = True
  p_ua = False
  p_ba = False
  p_sv = False
  for chr in prs[:4]:
    if chr.isnumeric():
      tmp = int(chr)
      if tmp >= 3 and tmp <= 8:
        p_wh = tmp
    else:
      if chr in splt.shps.keys():
        p_sh = chr
      elif chr in ['x', 'y', 'z', 'o']:
        p_lx = chr
      elif chr in ['+', '-']:
        p_tl = True if chr == '+' else False
      elif chr == 'u':
        p_ua = True
      elif chr == 'b':
        p_ba = True
      elif chr == 'v':
        p_sv = True

  return p_wh, p_sh, p_lx, p_tl, p_ua, p_ba, p_sv

....

  while True:
    # default values at start of loop
    do_plt = 1
    usr_ch = 'r'
    t_wh = None
    t_sh = None
    t_lx = None
    t_tl = True
    t_ua = False
    t_ba = False
    t_sv = False
    nw_pts = None

    # if 2nd iteration or later get user input, first iteration always random plot choice
    if lp_cnt > 0:
      usr_ch = input(f"\nq = quit or plot = 1 - {mx_plt} or r (random): ").strip().lower()
      # will accept q or x
      if usr_ch == 'q' or usr_ch == 'x':
        break
    lp_cnt += 1
    if usr_ch == 'r':
      # do_plt = np.random.randint(1, mx_plt + 1)
      do_plt = np.random.randint(1, mx_plt + 1)
      print(f"\nPlot type {do_plt} randomly selected.\n ({p_desc[do_plt]})\n")
    elif usr_ch[0:2] == 'bg':
      # flip status for background colour
      if len(usr_ch) == 2:
        use_bg = not use_bg
        print(f"Toggle use background colour, now {use_bg} ({t_bg} -> None)")
        t_bg = None
      else:
        use_bg = True
        t_bg = usr_ch[2:]
        print(f"Use Background colour: {t_bg}")
      continue
    elif usr_ch[0:3] == 'bb2':
      if len(usr_ch) == 3:
        # flip status for blotchy background
        use_bb2 = not use_bb2
        print(f"Toggle use blotchy background, now {use_bb2}")
      else:
        use_bb2 = True
        bb2_dim = int(usr_ch[3:])
        print(f"Use blotch_bg_2 background: {bb2_dim}")
      continue
    elif usr_ch[0:2] == 'bb':
      # flip status for blotchy background
      use_bb = not use_bb
      print(f"Toggle use blotchy background, now {use_bb}")
      continue
    elif usr_ch[0:2] == 'gd':
      # flip status for gradient background
      use_gd = not use_gd
      print(f"Toggle use background gradient, now {use_gd}")
      continue
    elif usr_ch[0:3] == 'rbg':
      # flip status for random colourmap for background
      use_rand_bg = not use_rand_bg
      print(f"Toggle use random background colourmap, now {use_rand_bg}")
      continue
    elif usr_ch[0] == 'p':
      # check for change to number plotting points
      new_pts = int(usr_ch[1:])
      print(f"You are setting the number of points plotted to {new_pts}")
      t_pts = new_pts
      continue
    else:
      t_plt, t_wh, t_sh, t_lx, t_tl, t_ua, t_ba, t_sv = sort_usr_input(usr_ch)
      if not t_plt:
        print(f'\nPlease enter a valid choice for plot type (1 - {mx_plt})!')
        continue
      elif t_wh or t_sh:
        do_plt = t_plt
        if t_sh:
          print(f"\nYou selected plot type {do_plt} with parameter(s): wheels -> {t_wh}, shape -> {t_sh} ({splt.shp_nm[t_sh]}).\n ({p_desc[do_plt]})\n")
        else:
          print(f"\nYou selected plot type {do_plt} with parameter(s): wheels -> {t_wh}, shape -> {t_sh}.\n ({p_desc[do_plt]})\n")
      else:
        do_plt = t_plt
        print(f"\nYou selected plot type {do_plt}\n({p_desc[do_plt]}).\n")
      print(f"use again: {t_ua}")
      if t_ba:
        print(f"use same background: {t_ba}")
      if not t_tl:
        print("Plot title turned off.")

...
As I mentioned, the code is a big mess. Something I am sure you can clearly see for yourself. There are currently 1400 lines of code, comments and commented out code. For my own personal practice and peace of mind, I do plan sometime this year to attempt a good refactoring.
Those continue statements cause the app to go back to the start of the loop and get fresh user input.
If I am going to produce a plot, I check all the various variables as I proceed with generating the curve data, any background colours, etc. Acting as appropriate at each step.
Here’s the section determining what the background should look like.
    if not (sv_plot or t_ba):
      if use_bg:
        if t_bg:
          c_bg = t_bg
        else:
          n_clr = int(lc_frq / 4)
          c_bg = cycle[np.random.randint(0, lc_frq)]
      else:
        c_bg = 'w'

      if not (sv_plot or t_ba):
        g_dir = np.random.uniform(0, 1)
        v_min = np.random.uniform(0, 0.4)
        v_max = np.random.uniform(0.6, 1.0)
        bg_lpha = np.random.randint(35, 75) / 100
        bax, abg = None, None
        # try different colourmaps for the background depending of curve colourmap
        if use_rand_bg:
          bg_cmnm = np.random.choice(bg_cmap[rcm])
          cmap = bgcm_mpl[bg_cmnm]
        else:
          bg_cmnm = rcm
          # don't need this function anymore, refactored as I wrote this part of the post
          # cmap = get_clrmap(rcm)
          cmap = bgcm_mpl[rcm]

    if ax:
      if use_bg:
        ax.set_facecolor(c_bg)
        ax.set_alpha(bg_lpha)
      elif use_gd or use_bb or use_bb2:
        lim_adj = 1.0
        xmin, xmax = plt.xlim()
        ymin, ymax = plt.ylim()
        xmin -= lim_adj
        xmax += lim_adj
        ymin -= lim_adj
        ymax += lim_adj
        if use_gd:
          gradient_image(ax, extent=(xmin, xmax, ymin, ymax), direction=g_dir, cmap_range=(v_min, v_max), transform=ax.transAxes, cmap=cmap, alpha=bg_lpha)
        elif use_bb:
          blotch_bg(ax, extent=(xmin, xmax, ymin, ymax), transform=ax.transAxes, cmap=cmap, alpha=bg_lpha)
        elif use_bb2:
          if sv_plot or t_ba:
            bax, abg = blotch_bg_2(ax, extent=(xmin, xmax, ymin, ymax), abg=abg, dim=bb2_dim, transform=ax.transAxes, cmap=cmap, alpha=bg_lpha)
          else:
            bax, abg = blotch_bg_2(ax, extent=(xmin, xmax, ymin, ymax), dim=bb2_dim, transform=ax.transAxes, cmap=cmap, alpha=bg_lpha)
Example Results
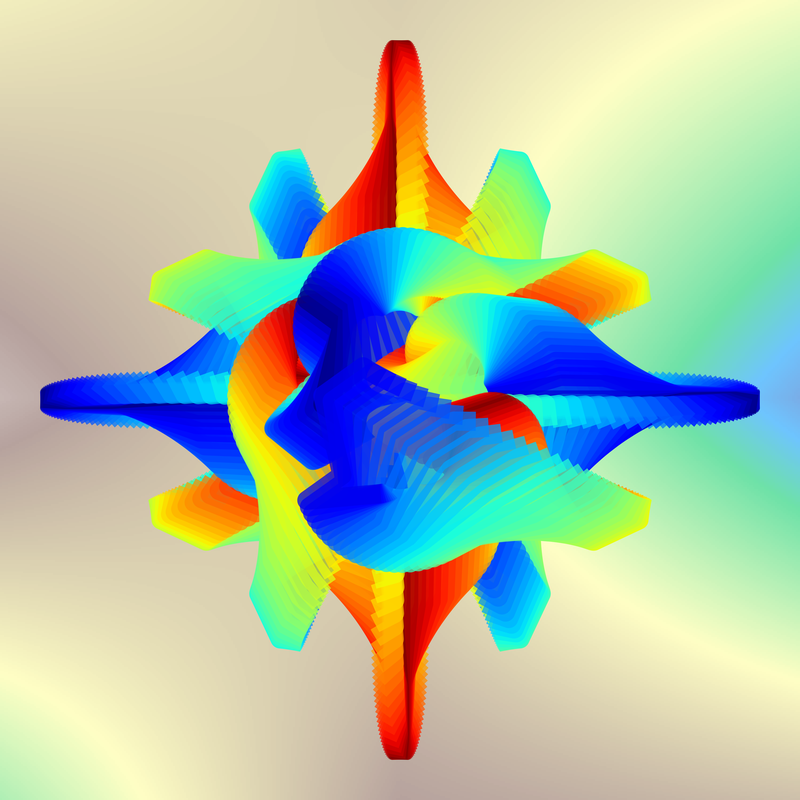
The plot uses the jet colourmap, the background uses the terrain colourmap. Doesn’t look too bad.
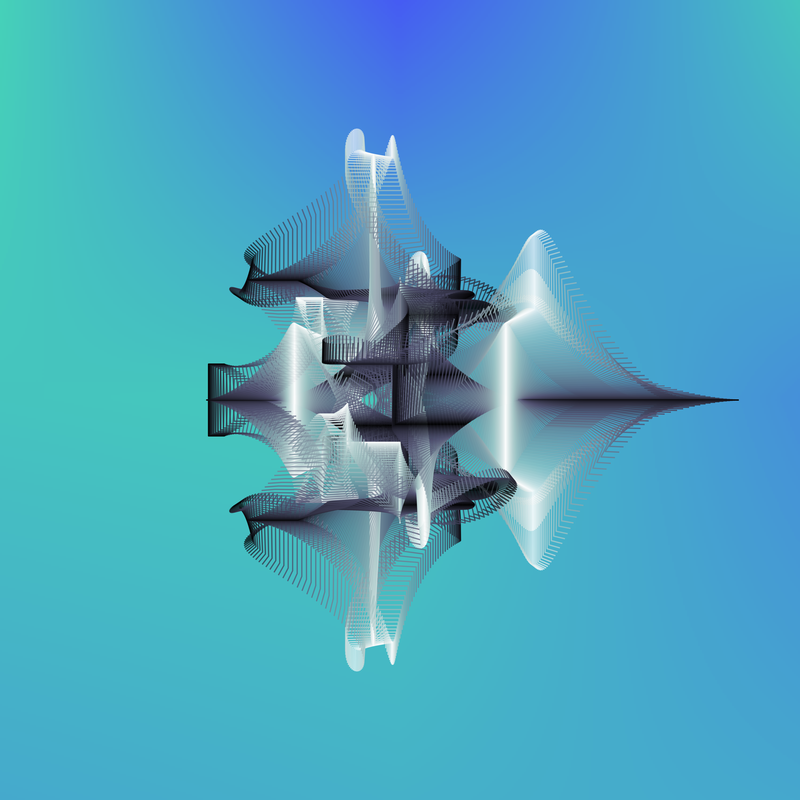
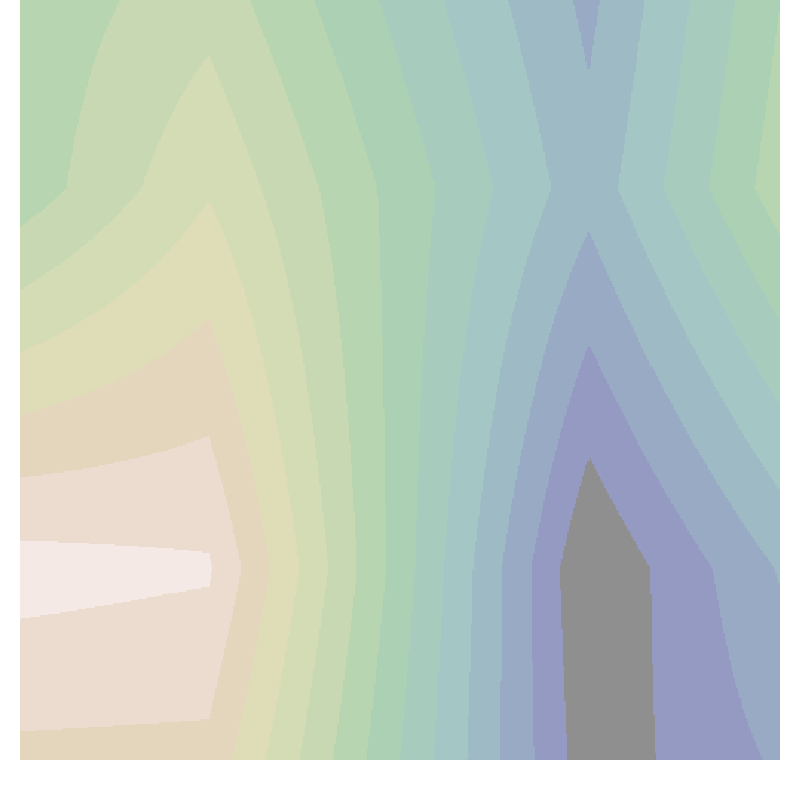
For this one, plot uses bone and background uses winter. Really quite like this one.
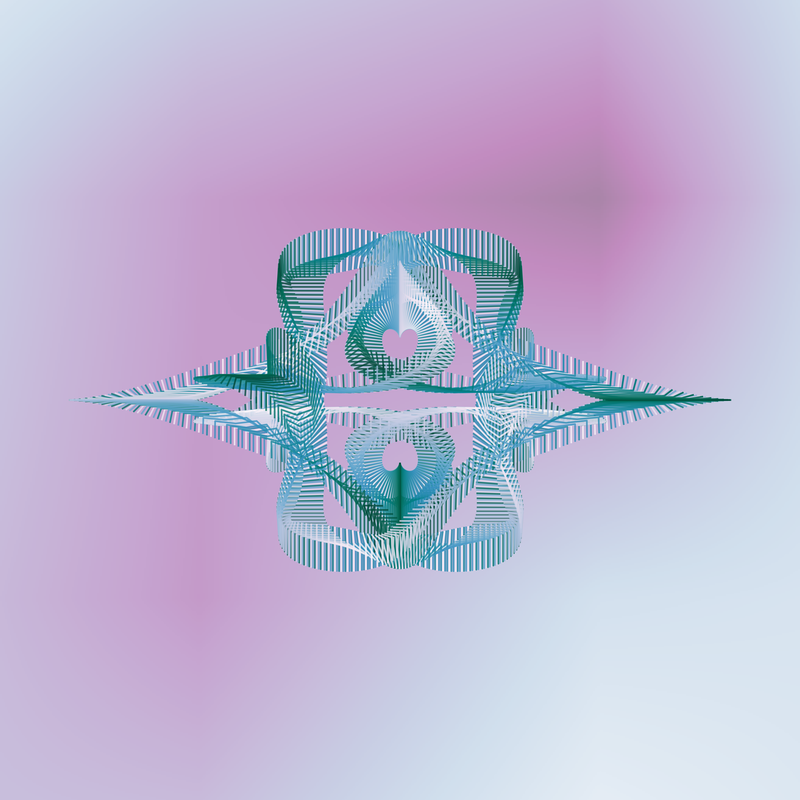
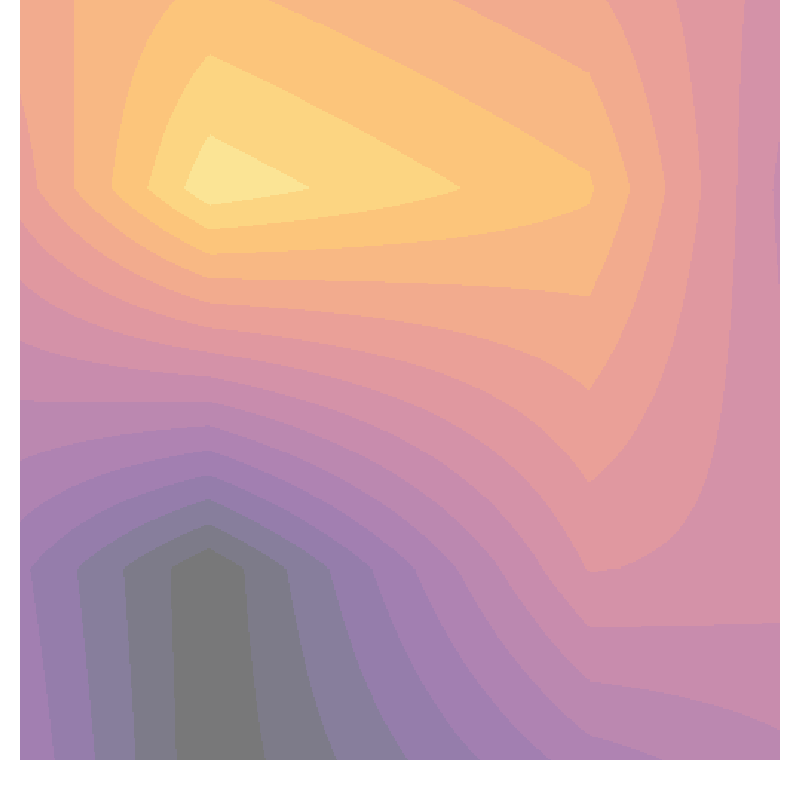
Here the curve detail uses PuBuGn and the background uses BuPu. The background does seem to enhance the plot image.
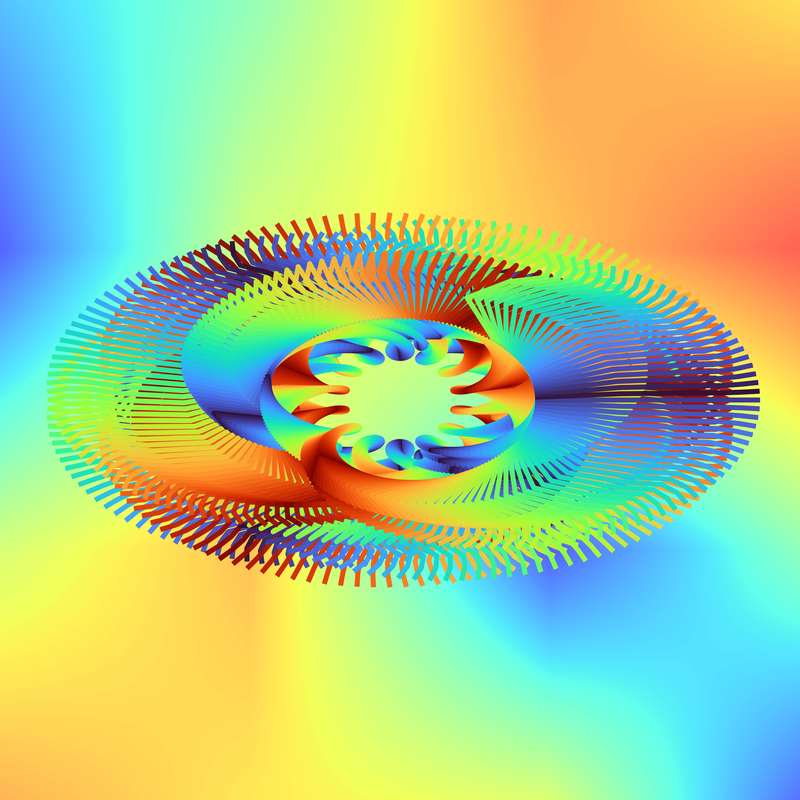
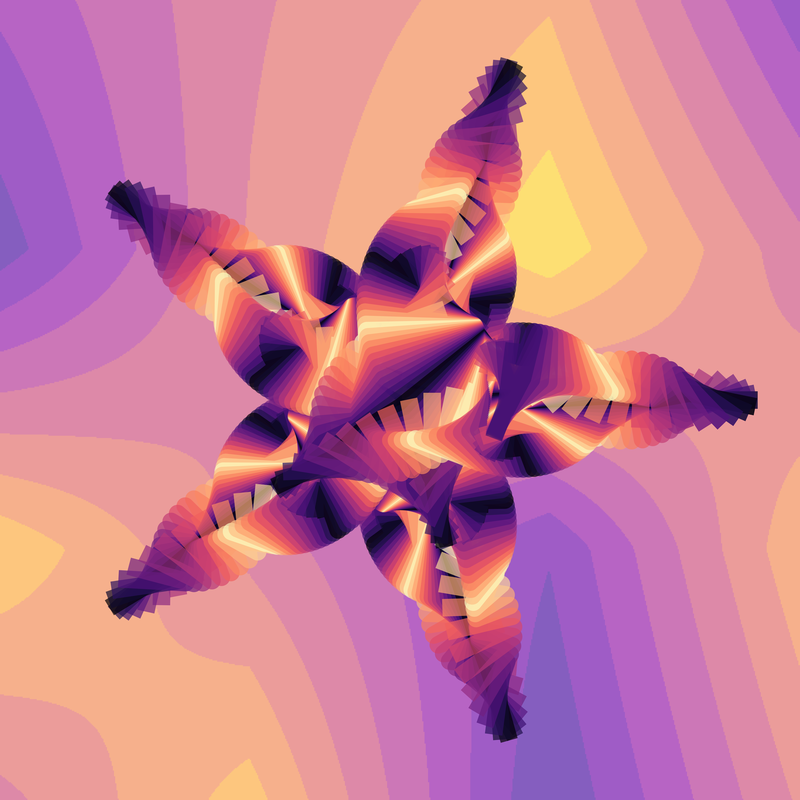
I have modified the second blotchy background function to default to an array dimension of 8. That seems to result in a more blotchy background. (Sorry, just haven’t managed to come up with a better word.) This uses that new default, turbo for the curve and jet for the background. Rather striking, though perhaps a touch too bold.
Discrete Colour Colourmaps
You may recall the strange backgrounds that were produced when the we used the tab10 colourmap. tab10 belongs to a colourmap group matplotlib refers to as qualitative. Most of the colourmaps being used belong to groups referred to as cyclical or sequential. The goal of the next exercise is to generate qualitative colourmaps from the sequential colourmaps.
Excluding a little hiccup or two, this proved to be deceptively simple. Example code on matplotlib certainly helped.
Given some number of colours and a colourmap, I extract said number of colours from the colourmap. Not getting fancy; just selecting equal distances apart over the range of the colourmap. Exactly what we do to get our colour cycle for plotting the curves. Then we use the method matplotlib.colors.LinearSegmentedColormap to generate a new qualitative style colourmap. The new colourmap is then used for our plot background.
Some New Variables and UI Checks
The list of control variables for the background has grown (and was rearranged).
...
use_bg = False  # use solid background colour
c_bg = "w"      # solid background colour
bg_cmap = None  # colour map to use for background
use_gd = False  # use gradient background
use_bb = False   # use blotchy background
use_bb2 = True  # use 2nd version blotchy background
bb2_dim = 8     # dimension for colour array
use_rand_bg = True  # select bg colour map from list available for current curve colour map
v_min = 0.2
v_max = 0.8
use_bd = False  # generate discrete colour map
bd_nbr = 10     # number of discrete colours to use for map
...
And, I added to the ui code to check for any user request to modify one of those new values.
...
    elif usr_ch[0:2] == 'bd':
      if len(usr_ch) == 2:
        # flip status for blotchy background
        use_bd = not use_bd
        print(f"Toggle make and use discrete background colour map, now {use_bd}")
      else:
        use_bd = True
        bd_nbr = int(usr_ch[2:])
        print(f"Make and use discrete background colour map: {bd_nbr}")
      continue
...
The Colourmap Generating Function
And, a small function to generate and return the new qualitative colourmap.
def make_cmap(cm_nm, nbr_c, alpha=1.0):
  b_cmap = bgcm_mpl[cm_nm]
  if cm_nm in ['default', 'tab20', 'tab20c']:
    return b_cmap
  colours = [b_cmap(i) for i in np.linspace(0, 1, nbr_c+1)][:-1]
  # specifying the N parameter very important in this case,
  # otherwise end up with a relatively sequential colour map
  cmap1 = mpl.colors.LinearSegmentedColormap.from_list("mycmap", colours, N=nbr_c, gamma=alpha)
  return cmap1
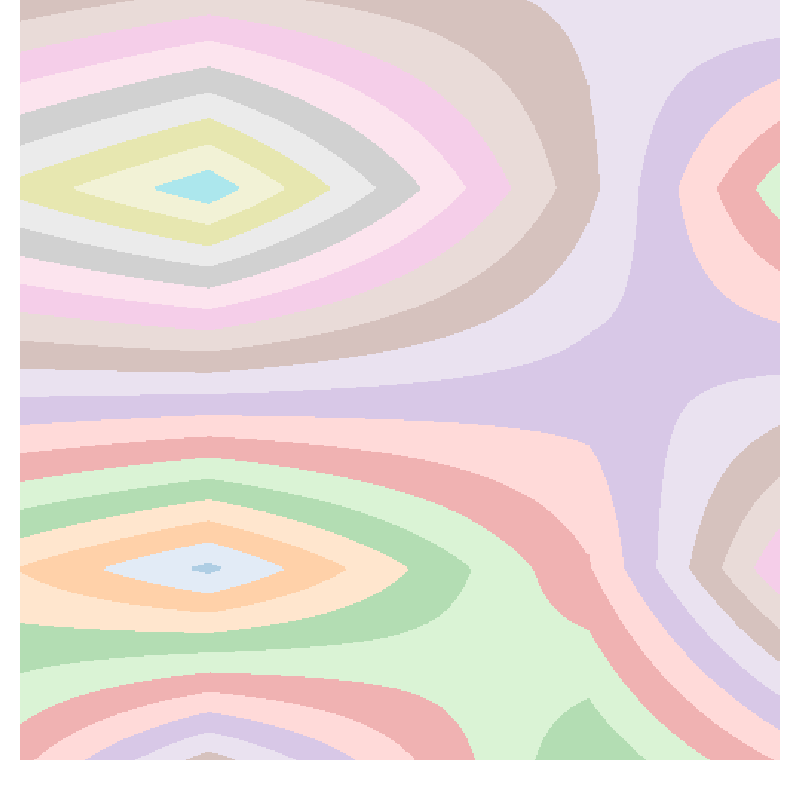
Wrote a small module to test the above function. Here’s a few examples.
And, here’s one using tab20 for comparison.
Spirograph Examples
Okay here’s a few with actual curves over this discrete colour colourmap kind of background.
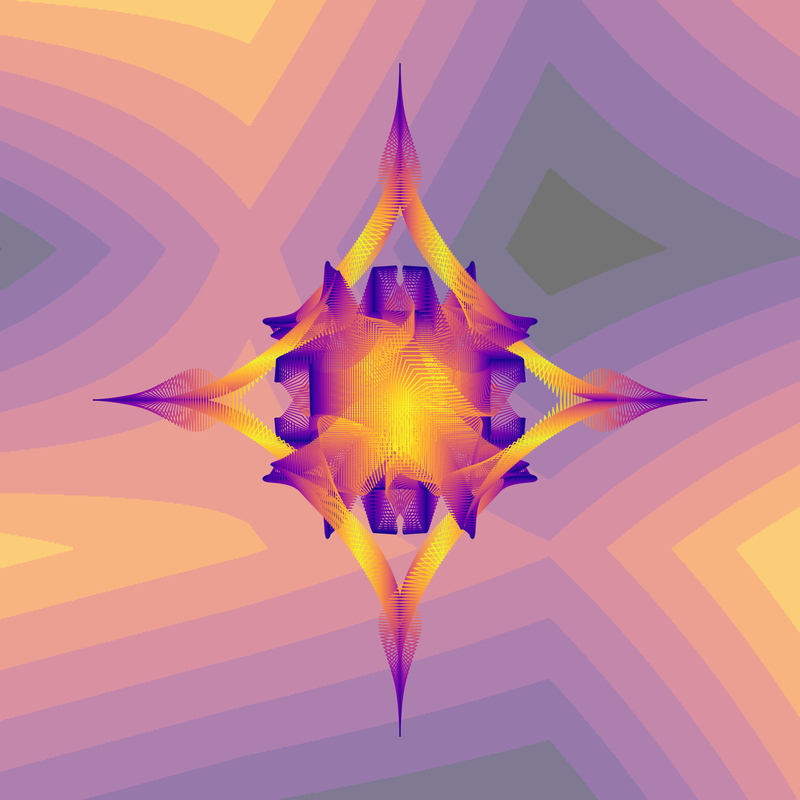
This one has a curve colourmap of plasma and a background colourmap of inferno with 10 distinct colours.
The next one has plasma for the background colourmap.
default colour map: magma, full gradient (25, (25, 4)), alpha: 0.69
use_rand_bg: True, use_bd: True (10), use_bg: False, use_gd: False, use_bb: False, use_bb2: True (8)
ln wd: 21, ln alpha: 0.69, ln drop: 0 (front), dpi: 600
blotch_bg_2(ax, extent=(-1.0, 2.0, dim=8, transform=ax.transAxes, cmap=plasma, alpha=0.64)
And:
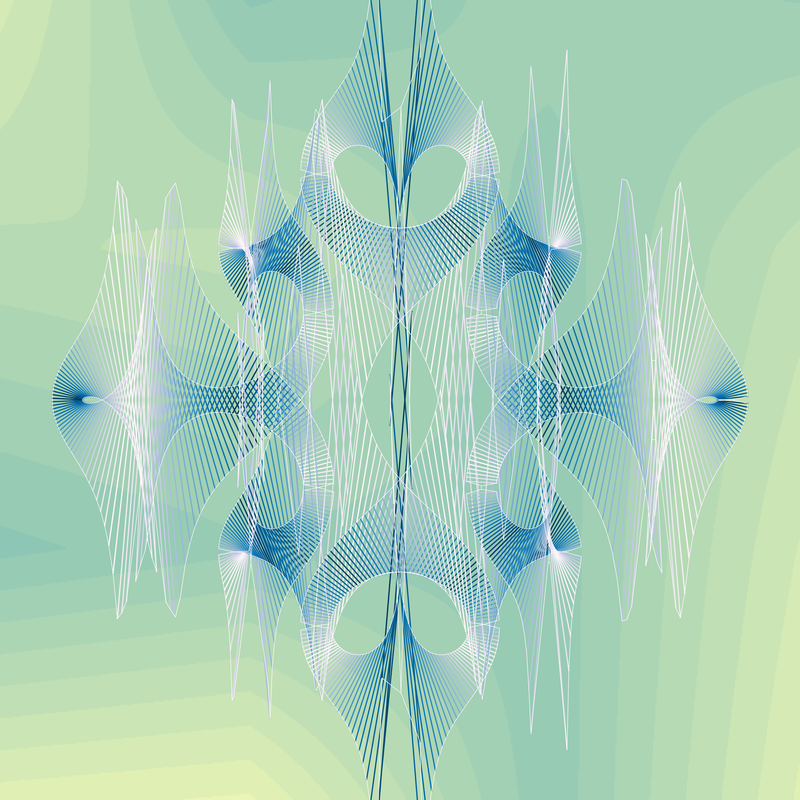
default colour map: PuBu, full gradient (50, (50, 4)), alpha: 0.95
use_rand_bg: True, use_bd: True (12), use_bg: False, use_gd: False, use_bb: False, use_bb2: True (8)
ln wd: None, ln alpha: 0.95, ln drop: 1 (front), dpi: 600
blotch_bg_2(ax, extent=(-1.0, 2.0, dim=8, transform=ax.transAxes, cmap=summer, alpha=0.49)
Sorry, one more.
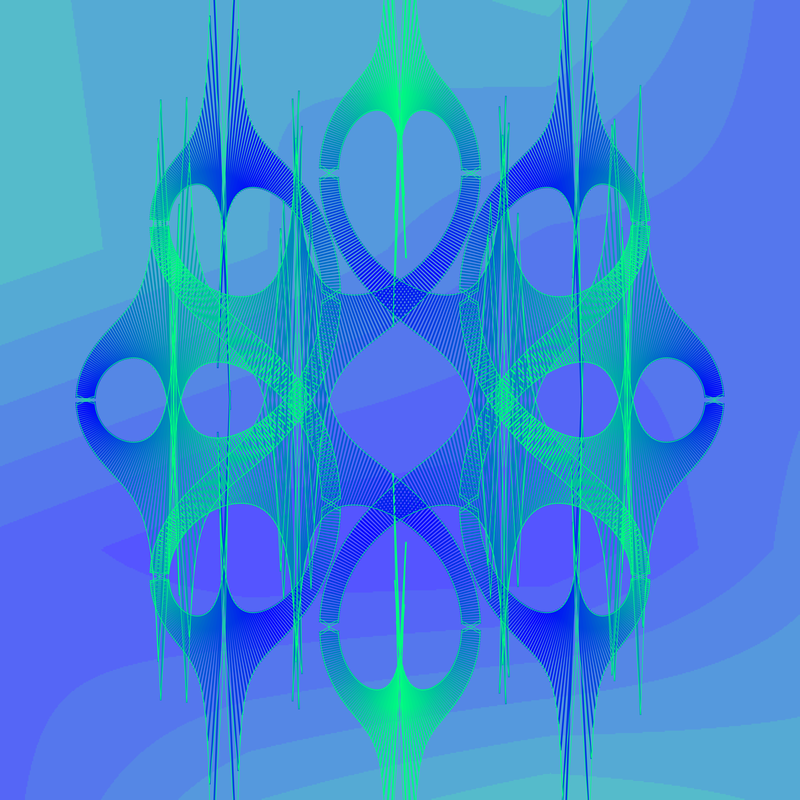
default colour map: winter, full gradient (100, (100, 4)), alpha: 0.73
use_rand_bg: True, use_bd: True (10), use_bg: False, use_gd: False, use_bb: False, use_bb2: True (8)
ln wd: 2, ln alpha: 0.73, ln drop: 1 (front), dpi: 600
blotch_bg_2(ax, extent=(-1.0, 2.0, dim=8, transform=ax.transAxes, cmap=winter, alpha=0.67)
Done M’thinks
That was a lot of fun. Which sadly must for now come to an end. Not sure all my choices for possible background colourmaps were good ones. But in general I haven’t been put off by the differing colourmaps. (Though I have never been accused of having a sense of colour.) Also, I quite like the images using the discrete colour colourmaps. Seems to add more interest than the sequential colourmaps. Though, maybe lighter backgrounds for this style would be more appropriate.
Until next time, enjoy your time coding.
Resources
- matplotlib.colors.LinearSegmentedColormap
- Choosing Colormaps in Matplotlib
- Creating Colormaps in Matplotlib
- custom_cmap.py — based on old verson of matplotlib, but…