Okay, last time we got a simple Flask app up and running in Google App Engine.
What I’d like to do now, is try to get a basic spirograph image displayed on a web page. Don’t know how challenging that will be as we are going to be generating the image on the fly so to speak. Not displaying an existing image. I don’t really want to save the images to a file if I can avoid doing so. Don’t need to clutter up the available disk space with unnecessary files.
I plan to let user’s specify some of the parameters to use in generating the spiropraph images. So, let’s start with that for the basic spirograph image.
Home Page
But first, we certainly don’t need that hello page any more. So, I will rename it to index.html, modify it’s content to include a link to the basic spirograph form page and rework the code for the domain root page route.
I am using the Flask method url_for to generate the correct link. It takes as its first parameter the route function not the route.
{% extends 'base.html' %}

{% block title %}TooOld2Code's Spirographs{% endblock %}

{% block content %}
  <h1>Play with Spirographs and Variations</h1>
  <p>My attempt to create a web app to generate spirographs using code I have been playing with locally for many months now.</p>
  <p>That code is not as it stands useable for this project so there will be a great deal of refactoring, perhaps creating new modules, etc.</p>

  <h2>Spirograph Variations</h2>
    <a href="{{ url_for('sp_basic') }}">Basic Spirograph</a>
  {% endblock %}
# set route to home/index page
@app.route('/')
def index():
  return render_template('index.html')
Basic Spirograph Curve
Basically I will provide a form allowing the user to specify the number of wheels, and perhaps a few other parameters. Then use that information to generate and display the resulting spirograph. For now I will only use circle shaped wheels. This is really only another test/learning cycle.
So a new template that provides a suitable form. Not really sure about overall routing for the total project at the moment. But for this one we will use /spirograph/basic. I plan to use get for the form, and post to generate the image.
Number of Wheels
Okay, let’s create a quick form. Not going to worry about making it pretty just yet. Just want to test the basic functionality. Add get_basic.html to the templates directory. For now just get a couple pieces of information.
{% extends 'base.html' %}
{% block title %}Generate a Basic Spirograph{% endblock %}
{% block content %}
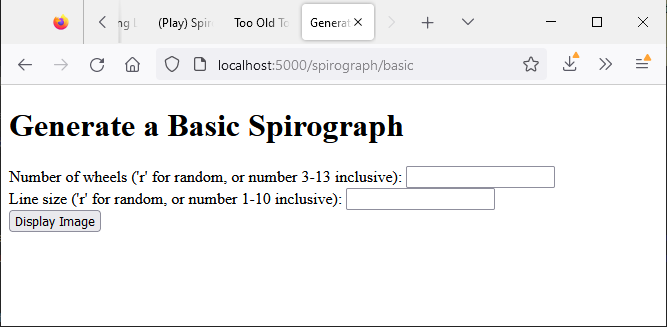
<h1>Generate a Basic Spirograph</h1>
<form action="/spirograph/basic" method="post">
<div class="preference">
<label for="wheels">Number of wheels ('r' for random, or number 3-13 inclusive): </label>
<input type="text" name="wheels"/>
</div>
<div class="preference">
<label for="ln_sz">Line size ('r' for random, or number 1-10 inclusive): </label>
<input type="text" name="ln_sz"/>
</div>
<input type="submit" value="Display Image" />
</form>
{% endblock %}
Certainly ain’t pretty, but seems to work.
Route
Okay let’s add the route to main.py. But, because I also plan to use a POST request on this route, we need to let Flask know that bit of information. For now, for the POST request, I am just going to display the form information. I also needed to add request to the Flask import statment. Will create a new template, disp_basic.html. The POST handling code will, for now, pass the form data to it so it can display that information.
from flask import Flask, render_template, request

app = Flask(__name__)

...

@app.route('/spirograph/basic', methods=['GET', 'POST'])
def sp_basic():
  if request.method == 'GET':
    return render_template('get_basic.html')
  elif request.method == 'POST':
    n_whl = request.form.get('wheels')
    ln_sz = request.form.get('ln_sz')
    return render_template('disp_basic.html', n_whl=n_whl, ln_sz=ln_sz)
Display Template
As mentioned, this version for development only. So, nice and simple.
{% extends 'base.html' %}
{% block title %}Basic Spirograph Image{% endblock %}
{% block content %}
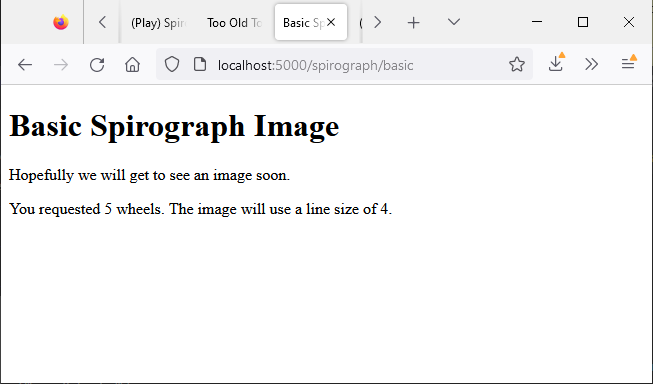
<h1>Basic Spirograph Image</h1>
<p>Hopefully we will get to see an image soon.</p>
<p>You requested {{ n_whl }} wheels. The image will use a line size of {{ ln_sz }}.</p>
{% endblock %}
And, everything seems to work.
Setting Up for Image Generation
Of course, a new conda environment means installing a number of packages again. Should have cloned the one I was previously using for the spirograph images. Ah well! So, I have added NumPy and matplotlib to start. Well, NumPy was installed by matplotlib (as a required library).
I am going to copy over the two spirograph related modules I had previously created. And I plan to use code from the main spirograph module in a new module in this app. That creates a bit of a problem. That spirograph module used a large number of module level variables. Many of which were used by functions contained in that module. When I copied one of those functions over to the new module, I got all sorts of complaining from VSCode regarding undefined variables.
To get around that issue without rewriting all the functions I am going to create a module containing those variables. Then import it in any other modules that need those variables available. But I am not going to do a global import. I will label the import as ‘g’ and use that to access the variables.
At the moment the global variable module, g_vars.py, looks something like this.
# app global variables
do_plt = 1  # not necessarily of value here,
            # but numerous instances in various functions

n_whl = 3   # nbr wheels
su = 'c'    # wheel shape
k_f = 2
cgv = 1
freqs = []  # rotational frequency for wheels
wds = []    # width of none circular shapes or diameter of circle
r_wds = []  # any imaginary widths converted to float
hts = []    # heights of none circular shapes
r_hts = []  # any imaginary heights converted to float
ln_w = 2    # line width for plot
t_pts = 512 # number of plotting points
rds = []    # angles (radians) to use for generating curves

drp_f = True  # drop from front or rear of dataset for gnarly images

t_sy = False  # attempt to plot more symmetric curve, using current algorithm
s_typ = 1     # method for attempted symmetry currently 1-11
t_rx = False
Generate and Display Curve
Okay, making this one section. But it might get to be longer than I generally like.
I am going to create a module to hold the functions I will be using to generate images. I won’t be displaying any of that code. You will need to work your way through my previous posts and sort that out yourself. In these posts I will be focusing on the web app specific code.
As mentioned, I copied over the modules, spiro_get_rnd.py and spiro_plotlib.py, I had written while working on my initial spirograph code and posts. I then added a new module, sp_app_lib.py, to which I will add functions/code from the main spirograph module. This module, along with main.py, will import the g_vars.py module. Any functions I add to sp_app_lib.py will need to be modified to use the variables from this latter module. E.G. g.n_whl instead of n_whl or g.t_pts instead of t_pts.
The code for the route /spirograph/basic now looks like this.
@app.route('/spirograph/basic', methods=['GET', 'POST'])
def sp_basic():
  if request.method == 'GET':
    return render_template('get_basic.html')
  elif request.method == 'POST':
    u_whl = request.form.get('wheels').lower()
    u_lw = request.form.get('ln_sz').lower()
    if u_whl == 'r':
      g.n_whl = np.random.randint(3, 13)
    else:
      g.n_whl = int(u_whl)
    if u_lw == 'r':
      g.ln_w = np.random.randint(1, 10)
    else:
      g.ln_w = int(u_lw)
    # 'k' fold symmetry
    g.k_f = np.random.randint(2, g.n_whl+1)
    # congruency vs k_f
    g.cgv = np.random.randint(1, g.k_f)
    # widths of none circular shapes or diameter of circle
    g.wds = get_radii(g.n_whl)
    # heights of none circular shapes
    g.hts = get_radii(g.n_whl)
    # get rid of the imaginary unit if present
    g.r_wds = [max(np.real(rd), np.imag(rd)) for rd in g.wds]
    g.r_hts = [max(np.real(rd), np.imag(rd)) for rd in g.hts]
    # get the actual frequencies and congruency
    g.cgv, g.freqs = get_freqs(nbr_w=g.n_whl, kf=g.k_f, mcg=g.cgv)

    # set up the required elements in spiro_plotlib.py and generate curve data
    splt.set_spiro(g.freqs, g.wds, g.hts, nbr_t=g.t_pts)
    t_xs, t_ys = splt.mk_curve(g.rds, shp=g.su)
    r_xs, r_ys, m_xs, m_ys, m2_xs, m2_ys = sal.get_gnarly_dset(t_xs, t_ys, 0, g.drp_f, g.t_sy)

    return render_template('disp_basic.html', n_whl=g.n_whl, ln_sz=g.ln_sz)
No image generation just yet. Want to test the current set up by just generating the spirograph curve data. And, it seems to run without any errors (once I fixed a bug or two).
So, let’s see if we can display the spirograph curve/image. As before we will remove all extraneous plot related axes, spines and the like. Check the matplotlib reference (see Resources) for a warning and additional information regarding using matplotlib in a web server.
I have used the code from the reference and previous code for creating a clean image of the spirograph. sp_basic() refactored as follows.
    # create figure and axes, don't want to use pyplot to produce image
    fig = Figure(figsize=(g.fig_sz, g.fig_sz), frameon=False, dpi=72)
    ax = fig.subplots()
    for spine in ax.spines.values():
      spine.set_visible(False)
    ax.tick_params(bottom=False, labelbottom=False, left=False, labelleft=False)
    ax.plot(t_xs[-1], t_ys[-1], lw=g.ln_w, alpha=1)

    # Save image to a temporary buffer.
    buf = BytesIO()
    fig.savefig(buf, format="png")
    # Embed the result in the html output.
    data = base64.b64encode(buf.getbuffer()).decode("ascii")

    return render_template('disp_basic.html', n_whl=g.n_whl, ln_sz=g.ln_w, sp_img=data)
And a wee change to the related page template.
{% extends 'base.html' %}

{% block title %}Basic Spirograph Image{% endblock %}

{% block content %}
  <h1>Basic Spirograph Image</h1>

    <p>Hopefully we will get to see an image soon.</p>
    <p>You requested {{ n_whl }} wheels. The image will use a line size of {{ ln_sz }}.</p>

    <img src='data:image/png;base64,{{ sp_img }}'/>
{% endblock %}
And, an example result.
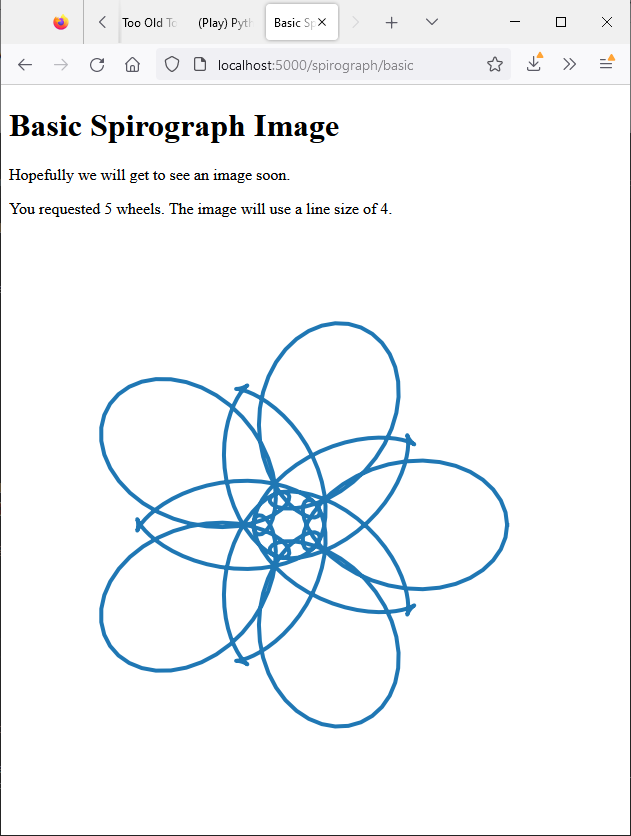
That’s what I call progress. Now to see if I can get it working on Google Cloud.
Deploy to Google Cloud
I did add some stuff to .gcloudignore before proceeding. E.G. VSCode files, my personal notes and such. Don’t know what effect that will have now, but worth a try. And, I had to add matplotlib and Numpy to requirements.txt. Which now looks like this.
flask==2.1.3
matplotlib==3.5.2
numpy==1.23.3
Then I ran a gcloud deploy. Well a couple of them. I had initially failed to update requirements.txt. Which resulted in a 502 Bad Gateway error (nginx) error.
PS R:\learn\py_play\sp_fa> gcloud app deploy
Services to deploy:

descriptor:                  [R:\learn\py_play\sp_fa\app.yaml]
source:                      [R:\learn\py_play\sp_fa]
target project:              [***]
target service:              [default]
target version:              [20221029t150126]
target url:                  [https://***.uw.r.appspot.com]
target service account:      [App Engine default service account]


Do you want to continue (Y/n)?  y

Beginning deployment of service [default]...
#=======================================+=====================#
#= Uploading 9 files to Google Cloud Storage                 =#
#========================================+====================#
File upload done.
Updating service [default]...done.
Setting traffic split for service [default]...done.
Deployed service [default] to [https://***.uw.r.appspot.com]

You can stream logs from the command line by running:
  $ gcloud app logs tail -s default

To view your application in the web browser run:
  $ gcloud app browse
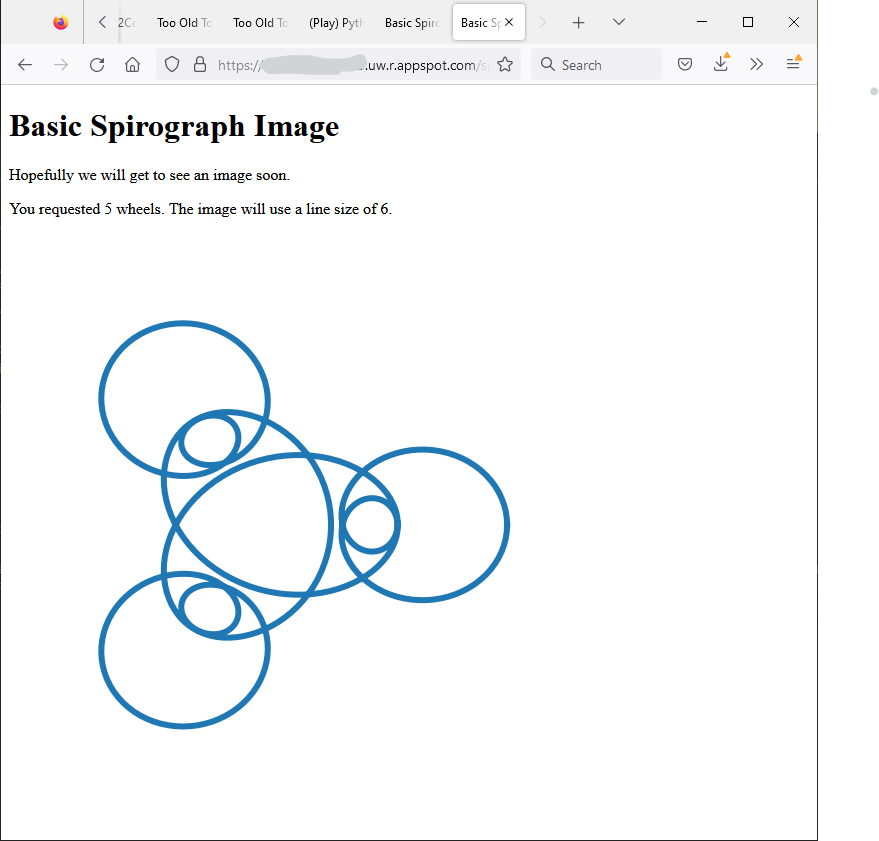
And, it appears to work.
Done
That seems like a decent amount of work and success for any post. So time to once again call it quits. Guess I can now remove that first line from the display image page.
Take care and have fun in the cloud.
Resources
- flask.Flask.url_for
- Embedding plot images in a web application server (Flask)
- How to make a cross-module variable?