Have run into a bit of a wall with respect to documenting what Lynn would need to do to get the blog working on his pc. So, going back to spirograps for awhile.
I have been saving info from a number of spirograph images with transforms. Let’s see if I can get those working in my repeat path.
I am going to start with a cycling line width style.
Refactor repeats Module and Related Functions
Based on the saved data for my first test, I need to add some fields to the repeat data dictionary. And, I am going to move one, ’ntr’. I have inserted the following fields just before the do_drpt field. The bottom portion of the dictionary now looks as follows.
{
  ### skip a bunch of fields
  'r_mlt': 'false',
  'ntr': '3',
  'lld_deg': [],
  'y_mlt': 0.5,
  'trdy': 1.061,
  'do_qd': [],
  'do_qd2': [],
  'do_drpt': 'false',
  'ani_step': 8,
}
There were only a few variables in the g_vars module dealing with transforms. In fact one called u_ntr and another called nbr_tr. The various values were obtained where needed by calling get_trfm_params(). So I will need to refactor the set_rpt_data() function to use the repeat data to update the appropriate global variables. And write a new function to mimic get_trfm_params() within the repeat path function. That function will return the identical values, but will use the repeat data dictionary as the source of the values where possible. And, of course, the repeat route function will need to be updated as well.
clw_btw_t
Refactoring
The pertinent portion of set_rpt_data() follows.
  # deal with repeat data for clw_btw
  g.u_lwpct = r.d_rpt[r.do_nbr]['clw_pct']
  g.u_lwcyc = r.d_rpt[r.do_nbr]['clwc']
  g.u_dppc = r.d_rpt[r.do_nbr]['clwpp']

  # and for transforms
  g.u_ntr = str(r.d_rpt[r.do_nbr]['ntr'])
  g.nbr_tr = r.d_rpt[r.do_nbr]['ntr']
The new function is pretty straightforward. This function is, currently, also in the main.py module. Should really move most of the functions in the module to another one (new or old).
def mk_trfm_params(i_data):
  lld_deg = i_data['lld_deg']
  lld_rot = [math.radians(ang) for ang in lld_deg]
  trdy = i_data['trdy']
  y_mlt = i_data['y_mlt']
  do_qd = i_data['do_qd']
  do_qd2 = i_data['do_qd2']
  return lld_rot, lld_deg, trdy, y_mlt, do_qd, do_qd2
And finally refactoring the sp_repeat route function. I added the following after the if block containing the plotting code for the previous image types.
    # image with transforms
    if r.d_rpt[r.do_nbr]['i_typ'][-2:] == '_t':
      lld_rot, lld_deg, trdy, y_mlt, do_qd, do_qd2 = mk_trfm_params(r.d_rpt[r.do_nbr])

      if 'clw_btw' in r.d_rpt[r.do_nbr]['i_typ']:
        clwy_1, clwy_2, i_param = sal.clw_btw_make(r_xs[-1], r_ys[-1], u_pcnt=g.use_pct, n_cyc=g.n_lwcyc, dppc=g.dpp_clr)
        tmp_rot = 0
        for i in do_qd2:
          if lld_deg[i] in [0.0, 90.0, 180.0, 270.0]:
            tmp_rot = 1.2 * lld_rot[i]
            dstx1, dsty1 = sal.get_transform_data(r_xs[-1], clwy_1, tmp_rot, lld_rot[i], trdy)
            _, dsty2 = sal.get_transform_data(r_xs[-1], clwy_2, tmp_rot, lld_rot[i], trdy)
          else:
            dstx1, dsty1 = sal.get_transform_data(r_xs[-1], clwy_1, lld_rot[i], lld_rot[i], trdy)
            _, dsty2 = sal.get_transform_data(r_xs[-1], clwy_2, lld_rot[i], lld_rot[i], trdy)

          pp_clr = sal.clw_btw_plot(ax, dstx1, dsty1, dsty2, dppc=g.dpp_clr)
          ax.autoscale()
Test
I added the data for an image of the clw_btw type with transforms to the repeats module. And, tried generating it. I got an image but it did not match the image I had saved. I have recently saved copies of some of the images for which I saved data, so I would be able to compare the repeat function output to the original I liked enough to want to repeat it.
Bug, Bug, Bug
When looking at the image data at the bottom of the display page, the cycling line width data I supplied was not what was being used to generate the repeat. Looking at the set_rpt_data() function it was rather obvious that I was not using some of the values to generate the repeated image. Not good that. So, need to refactor the function and perhaps the repeat route function. And, maybe more.
The following shows the values in the repeat data and the values generated by the repeat route when I tried to recreate the image.
Cycling Line Width

# original image data
    Use percentage increment: False
    Number cycles: 8
    Half cycle points: 128
    Multiplier increment: 0.0013751209071605377
    Number of maximums: 8
    Datapoints per colour section: 48

# data generated by repeat route
    Use percentage increment: False
    Number cycles: 8
    Half cycle points: 64                         <--
    Multiplier increment: 0.0027503143889428014   <--
    Number of maximums: 8
    Datapoints per colour section: 24             <--
Refactor clw_btw Related Code
set_rpt_data()
Okay let’s tackle the easy stuff first.
I did add one variable to the global variables module, u_minc. The muliplier used to generating the cycling line width was one of the values not being reused. I may need to add others as this refactoring moves along.
# cycle line width w/fill_between
u_lwpct = None
u_lwcyc = None
u_dppc = None
u_minc = None
Added code to handle it in set_rpt_data().
  # deal with repeat data for clw_btw
  g.u_lwpct = r.d_rpt[r.do_nbr]['clw_pct']
  g.u_lwcyc = r.d_rpt[r.do_nbr]['clwc']
  g.u_dppc = r.d_rpt[r.do_nbr]['clwpp']
  g.u_minc = r.d_rpt[r.do_nbr]['m_inc']
Test says nothing changed. So, some more code review (or would that be ‘soul searching’). Beginning to see just how haphazard my code for this app really is. So, a number of things not working correctly. Let’s look at the problems one by one.
The number of data points should in fact be 2048, not 1024. So, I added g.t_pts = r.d_rpt[r.do_nbr]['npts'] to set_rpt_data(). Still no change. A review of the code led me to the next step. I also have to (re)build the array of angles needed by the parametric equation. So added g.rds = np.linspace(0, 2*np.pi, g.t_pts) to the function. And that seems to have pretty much fixed most things. Even the ‘half cycle’ and ‘datapoints per section’ are now coming out correctly. But that latter is in fact more or less an accident. The code is just using defaults which just happen to work. So, I added code to the function to look after that properly. The function now looks like the following.
def set_rpt_data():
  # set repeat global
  g.do_rpt = True
  # intiialize and generate curve data
  # 'k' fold symmetry
  g.k_f = r.d_rpt[r.do_nbr]['k_f']
  # congruency vs k_f
  g.cgv = r.d_rpt[r.do_nbr]['cgv']
  # widths of non-circular shapes or diameter of circle
  g.wds = r.d_rpt[r.do_nbr]['wds']
  # heights of non-circular shapes
  g.hts = r.d_rpt[r.do_nbr]['hts']
  # get rid of the imaginary unit if present
  g.r_wds = [max(np.real(rd), np.imag(rd)) for rd in g.wds]
  g.r_hts = [max(np.real(rd), np.imag(rd)) for rd in g.hts]
  # rotational frequency for each wheel
  g.freqs = r.d_rpt[r.do_nbr]['freqs']
  # set datapoints and generate array of angles to match
  g.t_pts = r.d_rpt[r.do_nbr]['npts']
  g.rds = np.linspace(0, 2*np.pi, g.t_pts)
  # deal with the new repeat data values
  # following should be None or [] if not available
  g.cycle = r.d_rpt[r.do_nbr]['c_cyc']
  g.alph = r.d_rpt[r.do_nbr]['c_lpha']
  g.c_ndx = r.d_rpt[r.do_nbr]['c_ndx']
  g.abg = r.d_rpt[r.do_nbr]['abg']
  g.bg_lpha = r.d_rpt[r.do_nbr]['bg_lpha']
  # deal with repeat data for clw_btw
  g.u_lwpct = r.d_rpt[r.do_nbr]['clw_pct']
  g.u_lwcyc = r.d_rpt[r.do_nbr]['clwc']
  # set colour cycle parameters appropriately
  g.dpp_clr = int(r.d_rpt[r.do_nbr]['clwpp']) / (g.t_pts / 512)
  g.u_dppc = str(g.dpp_clr)
  g.u_minc = r.d_rpt[r.do_nbr]['m_inc']
  # deal with new repeat data values for transforms
  g.u_ntr = str(r.d_rpt[r.do_nbr]['ntr'])
  g.nbr_tr = r.d_rpt[r.do_nbr]['ntr']

  splt.set_spiro(g.freqs, g.wds, g.hts, nbr_t=g.t_pts)
Colours Not Correct
The image re-generated matches the original in most everyway. Except for the segment colours in two of the transformations. See below.
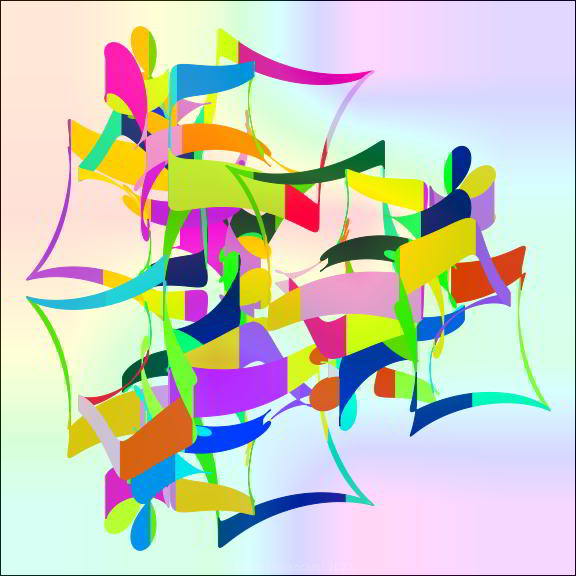
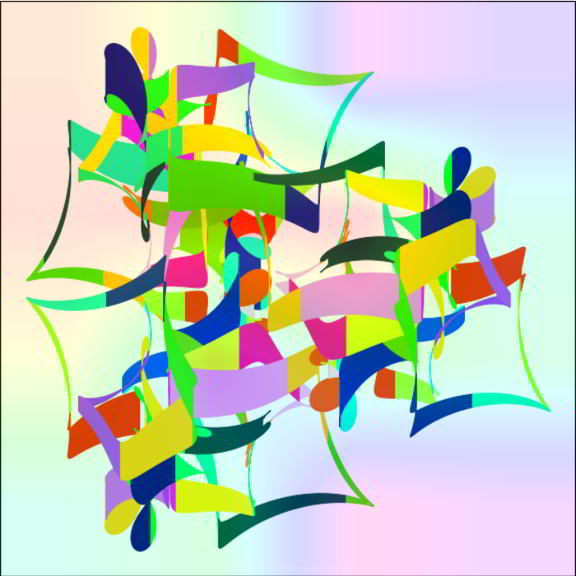
The colour segments on the rightmost transform match. They do not for those on the left of the image. And, I like the original with the colour variations much more than the repeated version with the same colour segments.
After a little thinking and code review, it became clear that I was only printing the last starting colour index to the display page when using transformations in the images. There would in fact be one such value for each transformation. For the repeat, I was using the same starting index for each transformation.
Further Refactoring
So I need to refactor all the transformation routes to display the full set of starting colour indexes. I will also have to refactor the repeat route code to use them appropriately.
Routes Using Transformations
Lots of repeated code in the all the non-repeat tranformation routes. I will display the changes for just one of them (git diff).
@@ -465,6 +466,9 @@ def sp_clw_btw_t():
     }
     return render_template('get_curve.html', type='basic', f_data=f_data)
   elif request.method == 'POST':
+    # store all starting colour numbers
+    all_cndx = []
+
     t_xs, t_ys, *_ = get_curve_data('clw_btw', request.form, 2048)
     setup_image(ax)
@@ -490,6 +494,8 @@ def sp_clw_btw_t():
         if lld_deg[i] in [0.0, 90.0, 180.0, 270.0]:
           print(F"\t\t==> {math.degrees(tmp_rot)}")
       pp_clr = sal.clw_btw_plot(ax, dstx1, dsty1, dsty2, dppc=g.dpp_clr)
+      all_cndx.append(g.c_ndx)
       ax.autoscale()

     data = fini_image(fig, ax)
@@ -497,11 +503,12 @@ def sp_clw_btw_t():
     d_end = "top" if g.drp_f else "bottom"
     c_data = sal.get_curve_dtl()
     i_data = sal.get_image_dtl(pg_ttl)
+    i_data['c_ndx'] = all_cndx
     p_data = {'mx_mlt': i_param['mx_sz'], 'mn_mlt': i_param['min_i'], 'm_inc': i_param['c_inc'],
               'hf_frq': i_param['h_cyc'], 'n_max': i_param['nbr_max'], 'pp_clr': pp_clr,
               'u_pct': g.use_pct, 'n_lwc': g.n_lwcyc,
               'ntr': g.nbr_tr, 'trang': lld_deg, 'trpt': f'(0, {round(trdy, 3)}) ({y_mlt})',
-              'trord': do_qd2
+              'trord2': do_qd2
               }

     return render_template('disp_image.html', sp_img=data, type='basic', c_data=c_data, i_data=i_data, p_data=p_data)
And the relevant output on the display page now looks something like this.
Drawing Parameters

    Colour map: twilight (0.75, [57, 36, 58, 34, 8, 61, 52, 5])
    BG colour map: jet (0.31)
Refactor Repeat Route
Now, I need to correctly deal with the revised colour index data. For image data saved before this refactor there will only be a single integer. For data collected from now on there will a list of integers. So, I have refactored set_rpt_data() to handle either case. If repeating an image with transformations, it checks for an integer value for the colour index. If so, it generates a suitably sized array of random index values. One for each transformation. Replacing the last entry with the index value in the repeat data.
  g.c_ndx = r.d_rpt[r.do_nbr]['c_ndx']
  if r.d_rpt[r.do_nbr]['i_typ'][-2:] == '_t' and isinstance(g.c_ndx, int):
    c_len = len(g.cycle)
    g.c_ndx = [rng.integers(0, c_len-2) for _ in range(int(r.d_rpt[r.do_nbr]['ntr']))]
    g.c_ndx[-1] = r.d_rpt[r.do_nbr]['c_ndx']
Now, in the route code, I repeatedly call sal.clw_btw_plot(). The following code selects the colour cycle starting index.
  if not g.do_rpt:
    c_ndx = rng.integers(0, c_len-2)
    g.c_ndx = c_ndx
  else:
    c_ndx = g.c_ndx
Trouble is g.c_ndx may now be a list. And, there is no easy way for me to specify which element of that list I want used for the current plot. So I added a new parameter. And modified the above code accordingly.
def clw_btw_plot(axt, rxs, rys1, rys2, dppc=12, u_ndx=None):
... ...
  if not g.do_rpt:
    c_ndx = rng.integers(0, c_len-2)
    g.c_ndx = c_ndx
  else:
    if u_ndx:
      c_ndx = u_ndx
    else:
      c_ndx = g.c_ndx
I then refactored the code in the loop handling the transformations accordingly.
       for ndx, i in enumerate(do_qd2):
... ...
         pp_clr = sal.clw_btw_plot(ax, dstx1, dsty1, dsty2, dppc=g.dpp_clr, u_ndx=g.c_ndx[ndx])
Test
With the above changes in place, I saved the data for an appropriate image. As well as a copy of the image.
clw_btw_t:
Curve Parameters
    Wheels: 3 wheels (shape(s): square (s))
    Symmetry: k_fold = 2, congruency = 1
    Frequencies: [-1, -7, -7]
    Widths: [1, 0.572261887970836j, 0.3392028341124735j]
    Heights: [1, 0.7320753023350426, 0.5349008504277923j]
    Data points: 1024
Drawing Parameters
    Colour map: turbo (0.75, [48, 36, 46, 38])
    BG colour map: PuBu (0.2)
    Line width (if used): 4
    Image size: 8
    Image DPI: 72
Transformations
    Number of transforms: 4
    Angles: [45.0, 135.0, 225.0, 315.0]
    Base linear translation point: (0, 0.708) (0.625)
    Order: [3, 1, 0, 2]
Cycling Line Width
    Use percentage increment: False
    Number cycles: 8
    Half cycle points: 128
    Multiplier increment: 0.0022138438991824603
    Number of maximums: 8
    Datapoints per colour section: 48
Colour Arrays
    Background array: [[0.56859972 0.63164207 0.76329253 0.38682792] [0.19622295 0.07891821 0.58929193 0.44603857] [0.4781404 0.18897122 0.33368703 0.52675636] [0.07515053 0.8568595 0.66512375 0.6005777 ]]
    Colour cycle: [(0.18995, 0.07176, 0.23217, 1.0), (0.225, 0.16354, 0.45096, 1.0), (0.25107, 0.25237, 0.63374, 1.0), (0.26816, 0.33825, 0.7805, 1.0), (0.27628, 0.42118, 0.89123, 1.0), (0.27543, 0.50115, 0.96594, 1.0), (0.25862, 0.57958, 0.99876, 1.0), (0.21382, 0.65886, 0.97959, 1.0), (0.15844, 0.73551, 0.92305, 1.0), (0.11167, 0.80569, 0.84525, 1.0), (0.09267, 0.86554, 0.7623, 1.0), (0.12014, 0.91193, 0.6866, 1.0), (0.19659, 0.94901, 0.59466, 1.0), (0.30513, 0.97697, 0.48987, 1.0), (0.42778, 0.99419, 0.38575, 1.0), (0.54658, 0.99907, 0.29581, 1.0), (0.64362, 0.98999, 0.23356, 1.0), (0.72596, 0.9647, 0.2064, 1.0), (0.80473, 0.92452, 0.20459, 1.0), (0.8753, 0.87267, 0.21555, 1.0), (0.93301, 0.81236, 0.22667, 1.0), (0.97323, 0.74682, 0.22536, 1.0), (0.99314, 0.67408, 0.20348, 1.0), (0.99593, 0.58703, 0.16899, 1.0), (0.9836, 0.49291, 0.12849, 1.0), (0.95801, 0.39958, 0.08831, 1.0), (0.92105, 0.31489, 0.05475, 1.0), (0.87422, 0.24526, 0.03297, 1.0), (0.81608, 0.18462, 0.01809, 1.0), (0.74617, 0.13098, 0.00851, 1.0), (0.66449, 0.08436, 0.00424, 1.0), (0.57103, 0.04474, 0.00529, 1.0), (0.4796, 0.01583, 0.01055, 1.0), (0.65345, 0.07902, 0.00408, 1.0), (0.72686, 0.11867, 0.00695, 1.0), (0.79971, 0.17055, 0.0152, 1.0), (0.8538, 0.2217, 0.02677, 1.0), (0.89888, 0.27824, 0.04243, 1.0), (0.94084, 0.35566, 0.07031, 1.0), (0.96904, 0.43399, 0.10294, 1.0), (0.98799, 0.51667, 0.13883, 1.0), (0.99672, 0.60977, 0.17842, 1.0), (0.99163, 0.68408, 0.20706, 1.0), (0.97323, 0.74682, 0.22536, 1.0), (0.93301, 0.81236, 0.22667, 1.0), (0.88331, 0.86553, 0.21719, 1.0), (0.82333, 0.91253, 0.20663, 1.0), (0.74617, 0.95593, 0.20406, 1.0), (0.67462, 0.98246, 0.2196, 1.0), (0.59891, 0.99638, 0.26038, 1.0), (0.50362, 0.99879, 0.32701, 1.0), (0.38127, 0.98909, 0.42386, 1.0), (0.27597, 0.97092, 0.51653, 1.0), (0.18491, 0.94484, 0.60713, 1.0), (0.11374, 0.90673, 0.69651, 1.0), (0.09267, 0.86554, 0.7623, 1.0), (0.10738, 0.81381, 0.83484, 1.0), (0.15173, 0.74472, 0.91416, 1.0), (0.20021, 0.67842, 0.96833, 1.0), (0.24427, 0.60937, 0.99697, 1.0), (0.27273, 0.5304, 0.98461, 1.0), (0.27698, 0.46153, 0.93309, 1.0), (0.27429, 0.39043, 0.85393, 1.0), (0.2628, 0.30639, 0.72968, 1.0)]
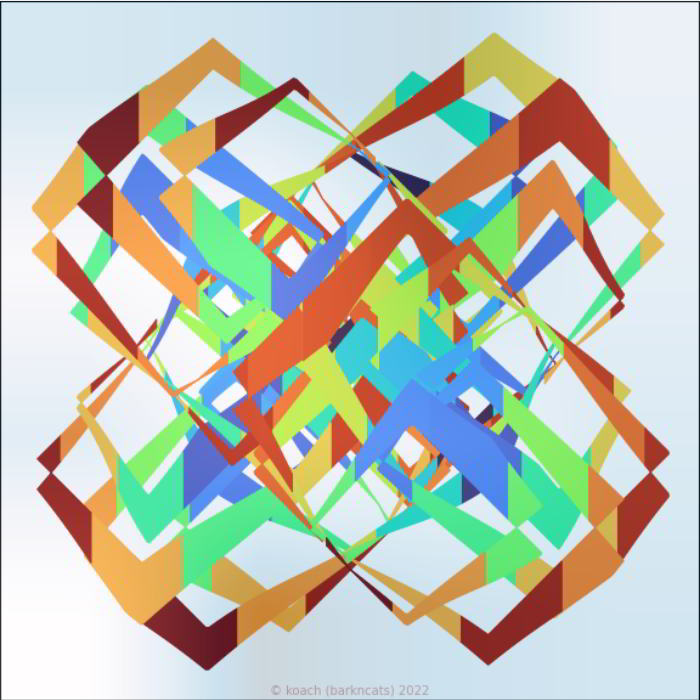

And, looks like an almost perfect repeat.
Done M’thinks
Wow, talk about a confusing refactor. Wonder if adding the other tranformation style images is going to be as much trouble.
But, I now know that future repeats of the clw_btw_t should work correctly.
May your refactoring trails be smoother than mine just was.