Well, that last post pretty much documented my going around in circles trying to sort some geometry, matplotlib, and numpy considerations, methods and such. But, the path to discovery is often rather circuitous. And, in this case, it was more or less successful, m’thinks. Now to see if it was worth the trouble.
Let’s go back to the data point labels and see if we can use the information available to us to determine, programmatically, where they should be placed. That is, where on the plot to avoid any overlap with other plot items (e.g. the state of charge curve).
Check Label Locations (Try 2?)
There are, as near as I can see, only a few locations that present issues for the data label placement. And, I expect I could easily code something with hard-coded values for those spots to sort things out. But, I would like to avoid that. Perhaps get something that might work with different curves and lines. Let’s see what can be done.
And new function. I will for each label, take it’s starting point and it’s inverse point, and see if the label overlaps either of those points. If so, I will take a shot a determining where it should go. I expect the function is going to need a lot of parameters. Though I will likely leave some of the information gathering to the function which will hopefully reduce some of the parameters.
As an initial set of parameters I plan to pass the axis, the starting point, the label text, the curve function and its inverse function. Let’s give the initial bits a shot.
def calc_pt_txt_pos(ax, tx, ty, txt, fn, i_fn):
  ''' Calculate the point at which to place text, possibly including alignment(S)

  :param ax: matplotlib plot axes
  :param tx: x-axis value for point of interest
  :param ty: y-axis value for point of interest
  :param txt: actual label text to add to plot
  :param fn: function for curve of interest; probably bad choice
  :param i_fn: inverse function for curve of interest; probably bad choice

  Returns: x and y coordinates for text position, plus dict of text style paramaters
    dict empty if don't need style parameters

  :bad choice: this requires the function to know what parameters each function
    requires. That is definitely not ensuring the separation of interests.
'''
  ...
Well! Already need a rethink. Let’s see if we can do this without the text positioning function needing access to those two functions.
def calc_pt_txt_pos(ax, a_txt, tx1, ty1, tx2):
  ''' Calculate the point at which to place text, possibly including alignment(S)

  :param ax: matplotlib plot axes
  :param a_txt: the artist for the text label under consideration
  :param tx1: x-axis value for point of interest
  :param ty1: y-axis value for point of interest
  :param tx2: the inverse x value if it exists, i.e. closest x where fn(x) = ty1

  Returns: x and y coordinates for text position, plus dict of text style paramaters
    dict empty if don't need style parameters
  '''
  ...
At this point, the function only needs to know how to get the bounding box and text from the artist. I am for now willing to live with that. Doesn’t seem unreasonable for the function to be coded to do that.
And, another refactoring, just like that. I have come to the conclusion that there is no way to make this function independent of the plot’s purpose and members. We are dealing with a cyclical curve (sine). We have to deal with a minimum and maximum value for the % charge. We are going to be plotting one or more tangents on that curve. There aren’t too many other cases that are going to look anything like that. But, I’ve come this far, so going to try and write something that can position the text for me for any point on the state of charge curve and for any tangent.
And because this function is project specific, I am not going to pass the text string to be plotted. I will determine that internally from the passed parameters.
I am thinking, I will not plot the text then get the function to check it. I will pass the axis and the 3 x/y values and let the function determine the text string and where it should go. I am also going to pass the estimated differential for the point(s) in question. That will allow me to determine if the point is a minimum or maximum on the curve. It will return the text plot location and any style paramters. Though I am thinking of just having it plot the text at the spot it determines to be best.
def calc_pt_txt_pos(ax, px1, py1, px2, slp, p_font):
  ''' Calculate the point at which to place text, possibly including alignment(s)

  :param ax: matplotlib plot axes
  :param px1: x-axis value for point of interest
  :param py1: y-axis value for point of interest
  :param px2: the inverse x value if it exists, i.e. closest x where fn(x) = ty1
  :param slp: differential for (tx1, ty1), i.e. slope of tangent line
  :param p_font: initial font dict to use for point related text
                 keys expected: 'color', 'size', 'va'
                 'color' and 'size' values will not change,
                 'ha' may be added, and 'va' changed

  Returns: x and y coordinates for text position, plus dict of text style paramaters
    dict empty if don't need style parameters
  '''
  p_txt = f"({tx1:.2f}, {ty1:.2f})"
  ...
Test Putting Text to the Right of Point
We will need the function to temporarily plot the text to the specified axis. Then check for overlaps and proceed accordingly if any found.
So, let’s start by temporarily adding the text to the plot and get its properties (well the ones we might be interested in). And since we will likely obtain the text properties a few times, let’s add a function to handle that. A bit of debug code included in the code that follows. Will eventually remove.
... ...
def get_txt_info(a_fig, a_txt):
  """ Get and return bbox, text styles for passed in text artist

    :param a_fig: reference to current figure
    :param a_txt: text artist for which to obtain bbox and such

    return: text bbox, text horizontal and vertical alignments
  """
  r = a_fig.canvas.get_renderer()
  bbp = a_txt.get_window_extent(renderer=r).transformed(plt.gca().transData.inverted())
  t_ha, t_va = plt.getp(a_txt, "ha"), plt.getp(a_txt, "va")
  # t_info = {
  #   'px0': bbp.x0,
  #   'py0': bbp.y0,
  #   'px1': bbp.x1,
  #   'py1': bbp.y1,
  #   'txt': plt.getp(a_txt, "text"),
  #   'ha': plt.getp(a_txt, "ha"),
  #   'va': plt.getp(a_txt, "va"),
  # }
  return bbp, t_ha, t_va


# Another rethink/plan
def calc_pt_txt_pos(ax, px1, py1, px2, slp, p_font):
  ''' Calculate the point at which to place text, possibly including alignment(s)

  :param ax: matplotlib plot axes
  :param px1: x-axis value for point of interest
  :param py1: y-axis value for point of interest
  :param px2: the inverse x value if it exists, i.e. closest x where fn(x) = ty1
  :param slp: differential for (tx1, ty1), i.e. slope of tangent line
  :param p_font: initial font dict to use for point related text
                 keys expected: 'color', 'size', 'va'
                 'color' and 'size' values will not change,
                 'ha' may be added, and 'va' changed

  Was originally thinking I would return the text location and font dict.
  In the end, chose to plot point and draw text. Nothing returned.

  Side effect: draws dot and text at data point location
  Returns: nothing
  '''
  do_dbg = True
  # we could use ax.get_window_extent to determine these values, but...
  x_min, x_max = 0, 24
  x_sep = .3
  t_try = {"l": False, "m": False, "r": False}
  is_ok = False
  t_font = copy.deepcopy(p_font)

  p_txt = f"({px1:.2f}, {py1:.2f})"
  if do_dbg:
    print(f"\ntest point location at: {p_txt}")

  if do_dbg:
    print(f"try to right of point:")
  r_pt = ax.text(px1 + x_sep, py1, p_txt, fontdict=p_font)

  # get info we need
  bbp, t_ha, t_va = get_txt_info(fig, r_pt)
  if do_dbg:
    s_ti = f"bbox: lr ({bbp.x0}, {bbp.y0}), ul ({bbp.x1}, {bbp.y1}),\n\t  align: ({t_info["ha"]}, {t_info["va"]}))"
    print(f"\t{s_ti}")
... ...
if blk_2b["txt3"]:
  # plot state of charge function
  fig, ax = plt.subplots(figsize=(8, 6))
  t = np.arange(0.0, 24.0, 0.05)
  s = soc_fn(t)
  xl = (0, 24)
  yl = (0, 100)
  socp = soc_plot(ax, t, s, xl, yl, params={"c": "k"})

  # plot point of interest
  px = 16.25
  py, p_df = soc_fn(px), est_df(soc_fn, px)
  px2 = soc_inv(py, px)
  print(f"(px, py): ({px}, {py}), px2: {px2}, p_df; {p_df}")
  p_font = {
    'color': 'b',
    'size': 9,
    'va': "center",
  }
  ax.scatter(px, py, alpha=.6, c=p_font["color"], s=40, clip_on=False)

  # sort placement of
  calc_pt_txt_pos(ax, px, py, px2, p_df, p_font)

  if blk_2b["sv_plt"]:
    fig.savefig(f"img/text_3_{i_blk + 1}.png")
  plt.show()
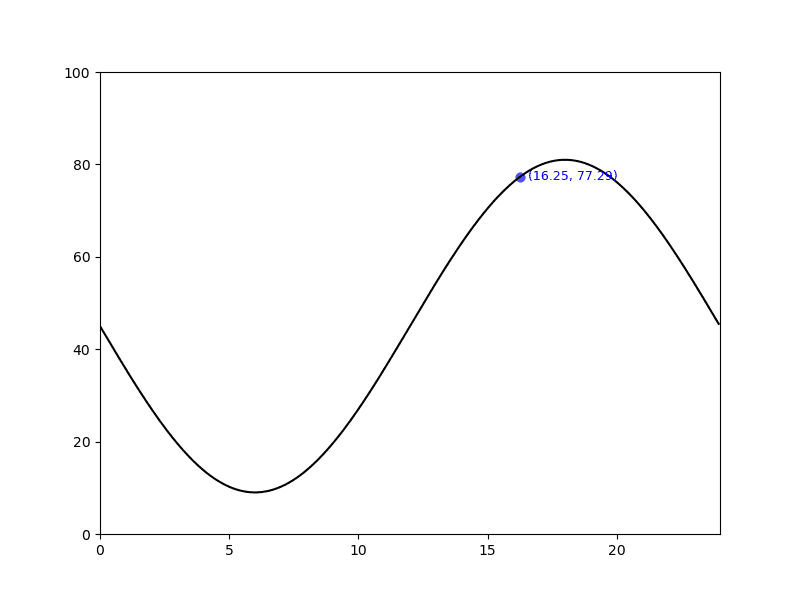
In the terminal I got the following.
(mc-3.14) PS R:\learn\mc\calculus> python txt_loc.py -c txt3
(px, py): (16.25, 77.28741869517678), px2: 19.75, p_df; 4.168472518231283

test point location at: (16.25, 77.29)
try to right of point:
        bbox: lr (16.550000000000004, 75.88049228825038), ul (20.0241935483871, 78.6943451021032),
          align: (left, center)
And the current plot, clearly showing the text overlapping the curve on the right.
Special Case
Okay, I am going to rework the text location function to deal with the minimum and maximum y-values. These are at the bottom or top of a curve, where the tangent will have slope of zero. So the text can not be to the left or right of the data point being looked at. It will be placed below or above the curve with some suitable spacing.
That means we need to control the steps the function takes in determining where to place the text. E.G. if we are at minima or maxima, no point doing any further checks. Ditto, if first attempt at placing text does not end up overlapping the curve or going out of bounds.
Instead of using the slope, I could likely use ax.get_window_extent to determine the minimum and maximum y-values and do some comparisons. Using the slope of the tangent just seems easier, as we already have a function to get that value.
... ...
  # test for maxima/minima, special case
  if round(slp, 0) == 0:
    if do_bg:
      print("handling min/max curve point")
    y_sep = 0.6
    if px1 > 12:
      # maxima
      t_y = py1 + y_sep
      t_font["va"] = "bottom"
    else:
      t_y = py1 - y_sep
      t_font["va"] = "top"
    t_font["ha"] = "center"
    if do_dbg:
      r_pt = ax.text(px1, t_y, p_txt, fontdict=t_font)
      t_try["m"] = True
    is_ok = True

  # try print text to right of point
  if not is_ok:
... ...
  # plot point of interest
  px = 6
... ...
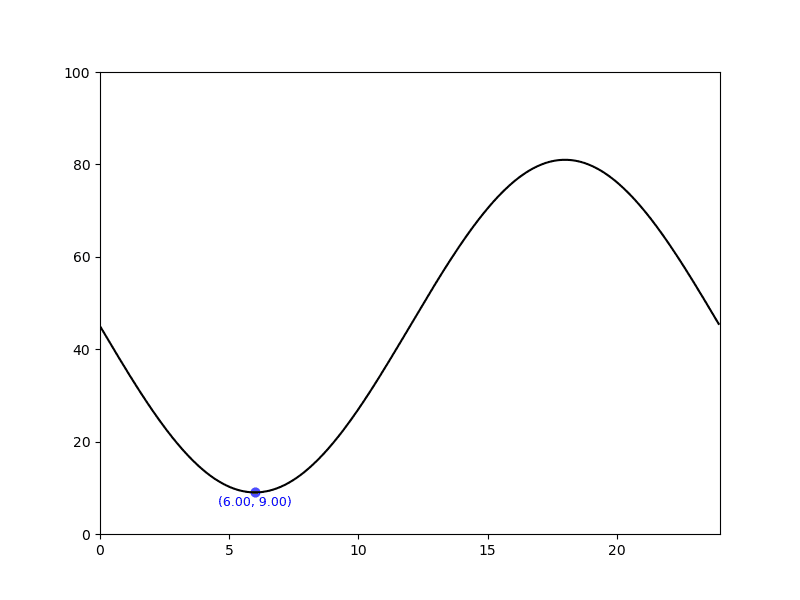
In the terminal, for \(x=18\) and \(x=6\), I got the following.
(mc-3.14) PS R:\learn\mc\calculus> python txt_loc.py -c txt3
(px, py): (18, 81.0), px2: 18.0, p_df; 0.0

test point location at: (18.00, 81.00)
handling min/max curve point

(mc-3.14) PS R:\learn\mc\calculus> python txt_loc.py -c txt3
(px, py): (6, 8.999999999999998), px2: 6.0, p_df; 0.0

test point location at: (6.00, 9.00)
handling min/max curve point
And only the plot showing the text positioned for \(x=6\).
Text to Right Overlaps Curve or Goes Out of Bounds
In this case I am going to try plotting the point text to the left of the curve and check for any problems with that location. In production situation, I would remove the text at the previous test location. But, for debug purposes I am going to leave it where it is. And, plot the text at the new location in red rather than the colour it should be in.
  # if not is_ok:
  if not is_ok
    # move to left of curve and check left edge outside axis
    if do_dbg:
      print(f"\ntry to left of point:")
    x_sep = 0.3
    t_font["color"] = "r" # for testing only
    if px1 <= 12:
      t_font["va"] = "top"
    else:
      t_font["va"] = "center"
    t_font["ha"] = "right"
    l_pt = ax.text(px1 - x_sep, py1, p_txt, fontdict=t_font)
    bbp, t_ha, t_va = get_txt_info(fig, l_pt)
    if do_dbg:
      s_ti = f"bbox: lr ({bbp.x0}, {bbp.y0}), ul ({bbp.x1}, {bbp.y1}),\n\t  align: ({t_ha}, {t_va})"
      print(f"\t{s_ti}")
    if px1 < px2:
      is_ovrlp = (bbp.x1 >= px1) or (bbp.x1 >= px2)
    else:
      is_ovrlp = (bbp.x1 >= px1) or (bbp.x0 <= px2)
    is_outbd = (bbp.x1 <= x_min)
    if do_dbg:
      print(f"\tis_overlp: {is_ovrlp}, is_outbd: {is_outbd}")
    is_ok = not (is_ovrlp or is_outbd)
Truly messy code in this function. Not sure how to fix it.
(mc-3.14) PS R:\learn\mc\calculus> python txt_loc.py -c txt3
args: Namespace(code_block='txt3', item=None, save=False)
(px, py): (16.25, 77.28741869517678), px2: 19.75, p_df; 4.168472518231283

test point location at: (16.25, 77.29)
try to right of point:
        bbox: lr (16.550000000000004, 75.88049228825038), ul (20.0241935483871, 78.6943451021032),
          align: (left, center)
        is_overlp: True, is_outbd: False

try to left of point:
        bbox: lr (12.475806451612904, 75.88049228825038), ul (15.95, 78.6943451021032),
          align: (right, center)
        is_overlp: False, is_outbd: False
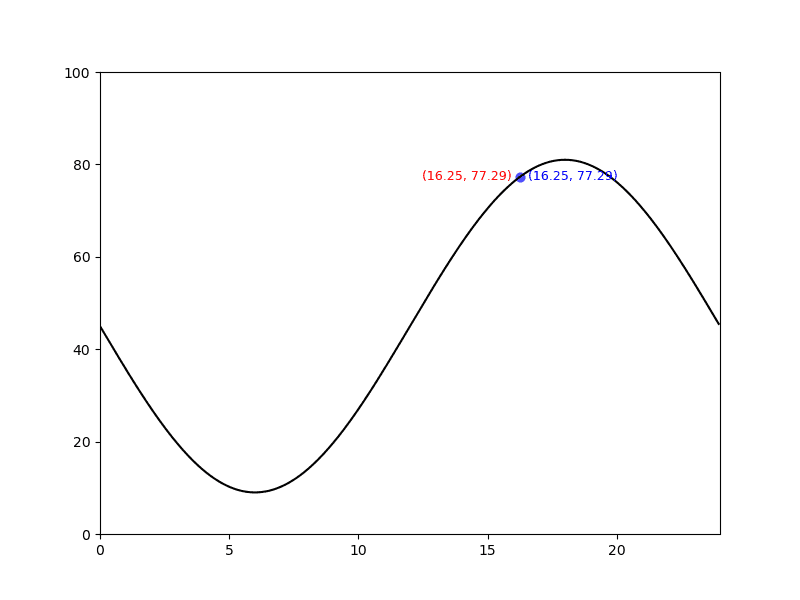
And that seems to work. Let’s try another location.
(mc-3.14) PS R:\learn\mc\calculus> python txt_loc.py -c txt3 -s
(px, py): (5.75, 9.077078763410272), px2: 6.250000000000002, p_df; -0.6164098634910715

test point location at: (5.75, 9.08)
try to right of point:
        bbox: lr (6.049999999999999, 7.670152356483863), ul (8.904838709677419, 10.484005170336678),
          align: (left, center)
        is_overlp: True, is_outbd: False

try to left of point:
        bbox: lr (2.5951612903225802, 6.263225949557457), ul (5.449999999999999, 9.077078763410269),
          align: (right, top)
        is_overlp: False, is_outbd: False
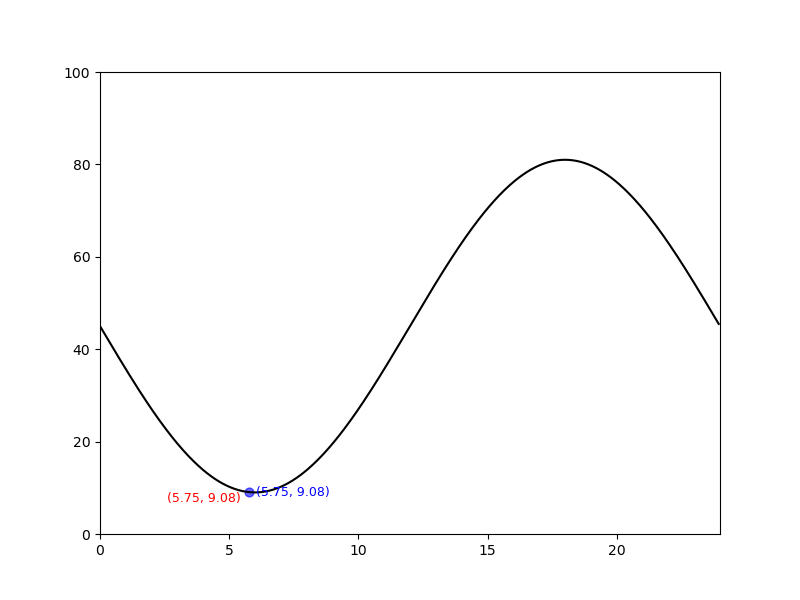
And, one more.
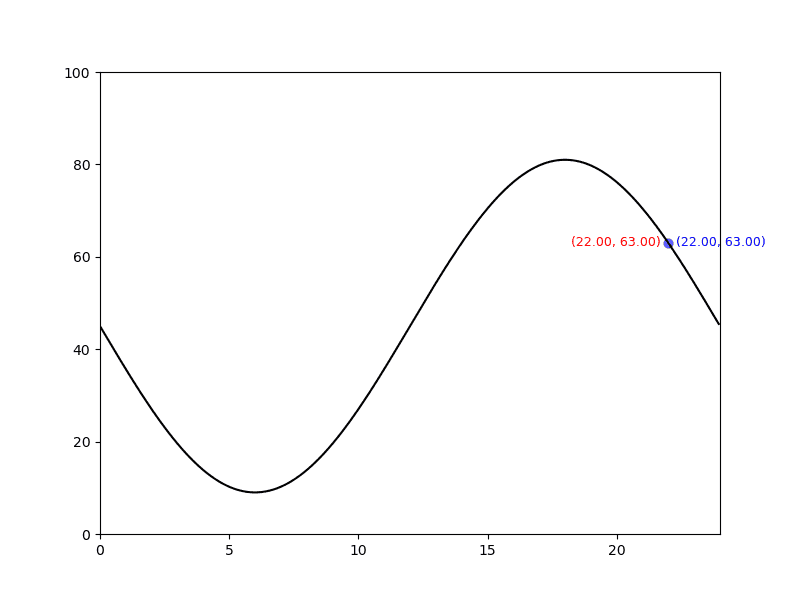
(mc-3.14) PS R:\learn\mc\calculus> python txt_loc.py -c txt3 -s
(px, py): (22.0, 63.000000000000014), px2: 14.0, p_df; -8.16209705014262

test point location at: (22.00, 63.00)
try to right of point:
        bbox: lr (22.300000000000004, 61.593073593073605), ul (25.7741935483871, 64.40692640692643),
          align: (left, center)
        is_overlp: False, is_outbd: True

try to left of point:
        bbox: lr (18.2258064516129, 61.593073593073605), ul (21.7, 64.40692640692643),
          align: (right, center)
        is_overlp: False, is_outbd: False
Okay, things seem to be working more or less as wanted. I am not going to worry about whether or not the text to the left is troublesome. Just looking at things, it seems to me that will not be a problem. Time will tell when we move on to plotting the tangent and adding the text of the equation to the plot.
Let’s fix a thing or two.
... ...
    # remove the test text to right
    r_pt.remove()

  if not is_ok:
    # remove the previous test text
    r_pt.remove()
    # move to left of curve and check left edge outside axis
    if do_dbg:
      print(f"\ntry to left of point:")
    x_sep = 0.3
    # remove the following line as for testing only
    # t_font["color"] = "r" # for testing only
... ...
    # remove test text to left
    l_pt.remove
And, I assure you, the text on the left is now in the correct colour and the text on the right is removed if text is moved to the left.
How to Finish Function?
Not quite done though. I need to decide whether the function will plot the text or return the information the caller needs to plot the text.
After some time away from the code and a night’s rest, I have decided to have the function plot the point and draw the text to the provided figure axis. Seems to make sense to me. Everything related to plotting the point and its associated text in one place.
So I am going to rename the function, and rework it to plot the point and draw the text. Don’t think we need to change the function parameters in any way.
Here’s the changed bits of code (I hope).
... ...
def draw_dpt_txt(ax, px1, py1, px2, slp, p_font):
  ''' Calculate the point at which to place text, possibly including alignment(s).
      Plot point and draw text to supplied figure axis.
    ... ...
  '''
... ...
  p_txt = f"({px1:.2f}, {py1:.2f})"
  # plot point using colouer in passed font dict
  a_pt = ax.scatter(px1, py1, alpha=.6, c=p_font["color"], s=40, clip_on=False)
... ...
  # test for maxima/minima, special case
  if round(slp, 0) == 0:
... ...
    r_pt = ax.text(px1, t_y, p_txt, fontdict=t_font)
    is_ok = True
... ...
    # remove the test text to right if not in a good location
    if not is_ok:
      r_pt.remove()
... ...
    # the following to be removed, for purpose of post just commenting out
    # remove test text to left
    # l_pt.remove
... ...
  # ax.scatter(px, py, alpha=.6, c=p_font["color"], s=40, clip_on=False)

  # sort placement of
  # calc_pt_txt_pos(ax, px, py, px2, p_df, p_font)
  draw_dpt_txt(ax, px, py, px2, p_df, p_font)
And, with some simple tests, that appears to work as intended.
Once More, Done
Well, this text related coding and post(s) is certainly taking longer and more posts than I expected. And, looks like there will be at least one more post. It will look at coding a function to plot the tangent and draw the text showing its equation. Expect it will be just as muddled up as the one for the data point and its text.
‘Til next time, do try to enjoy wherever your projects take you. No matter how convoluted that trip may prove.